Elements of effective data visualisation
Data Visualisation with R

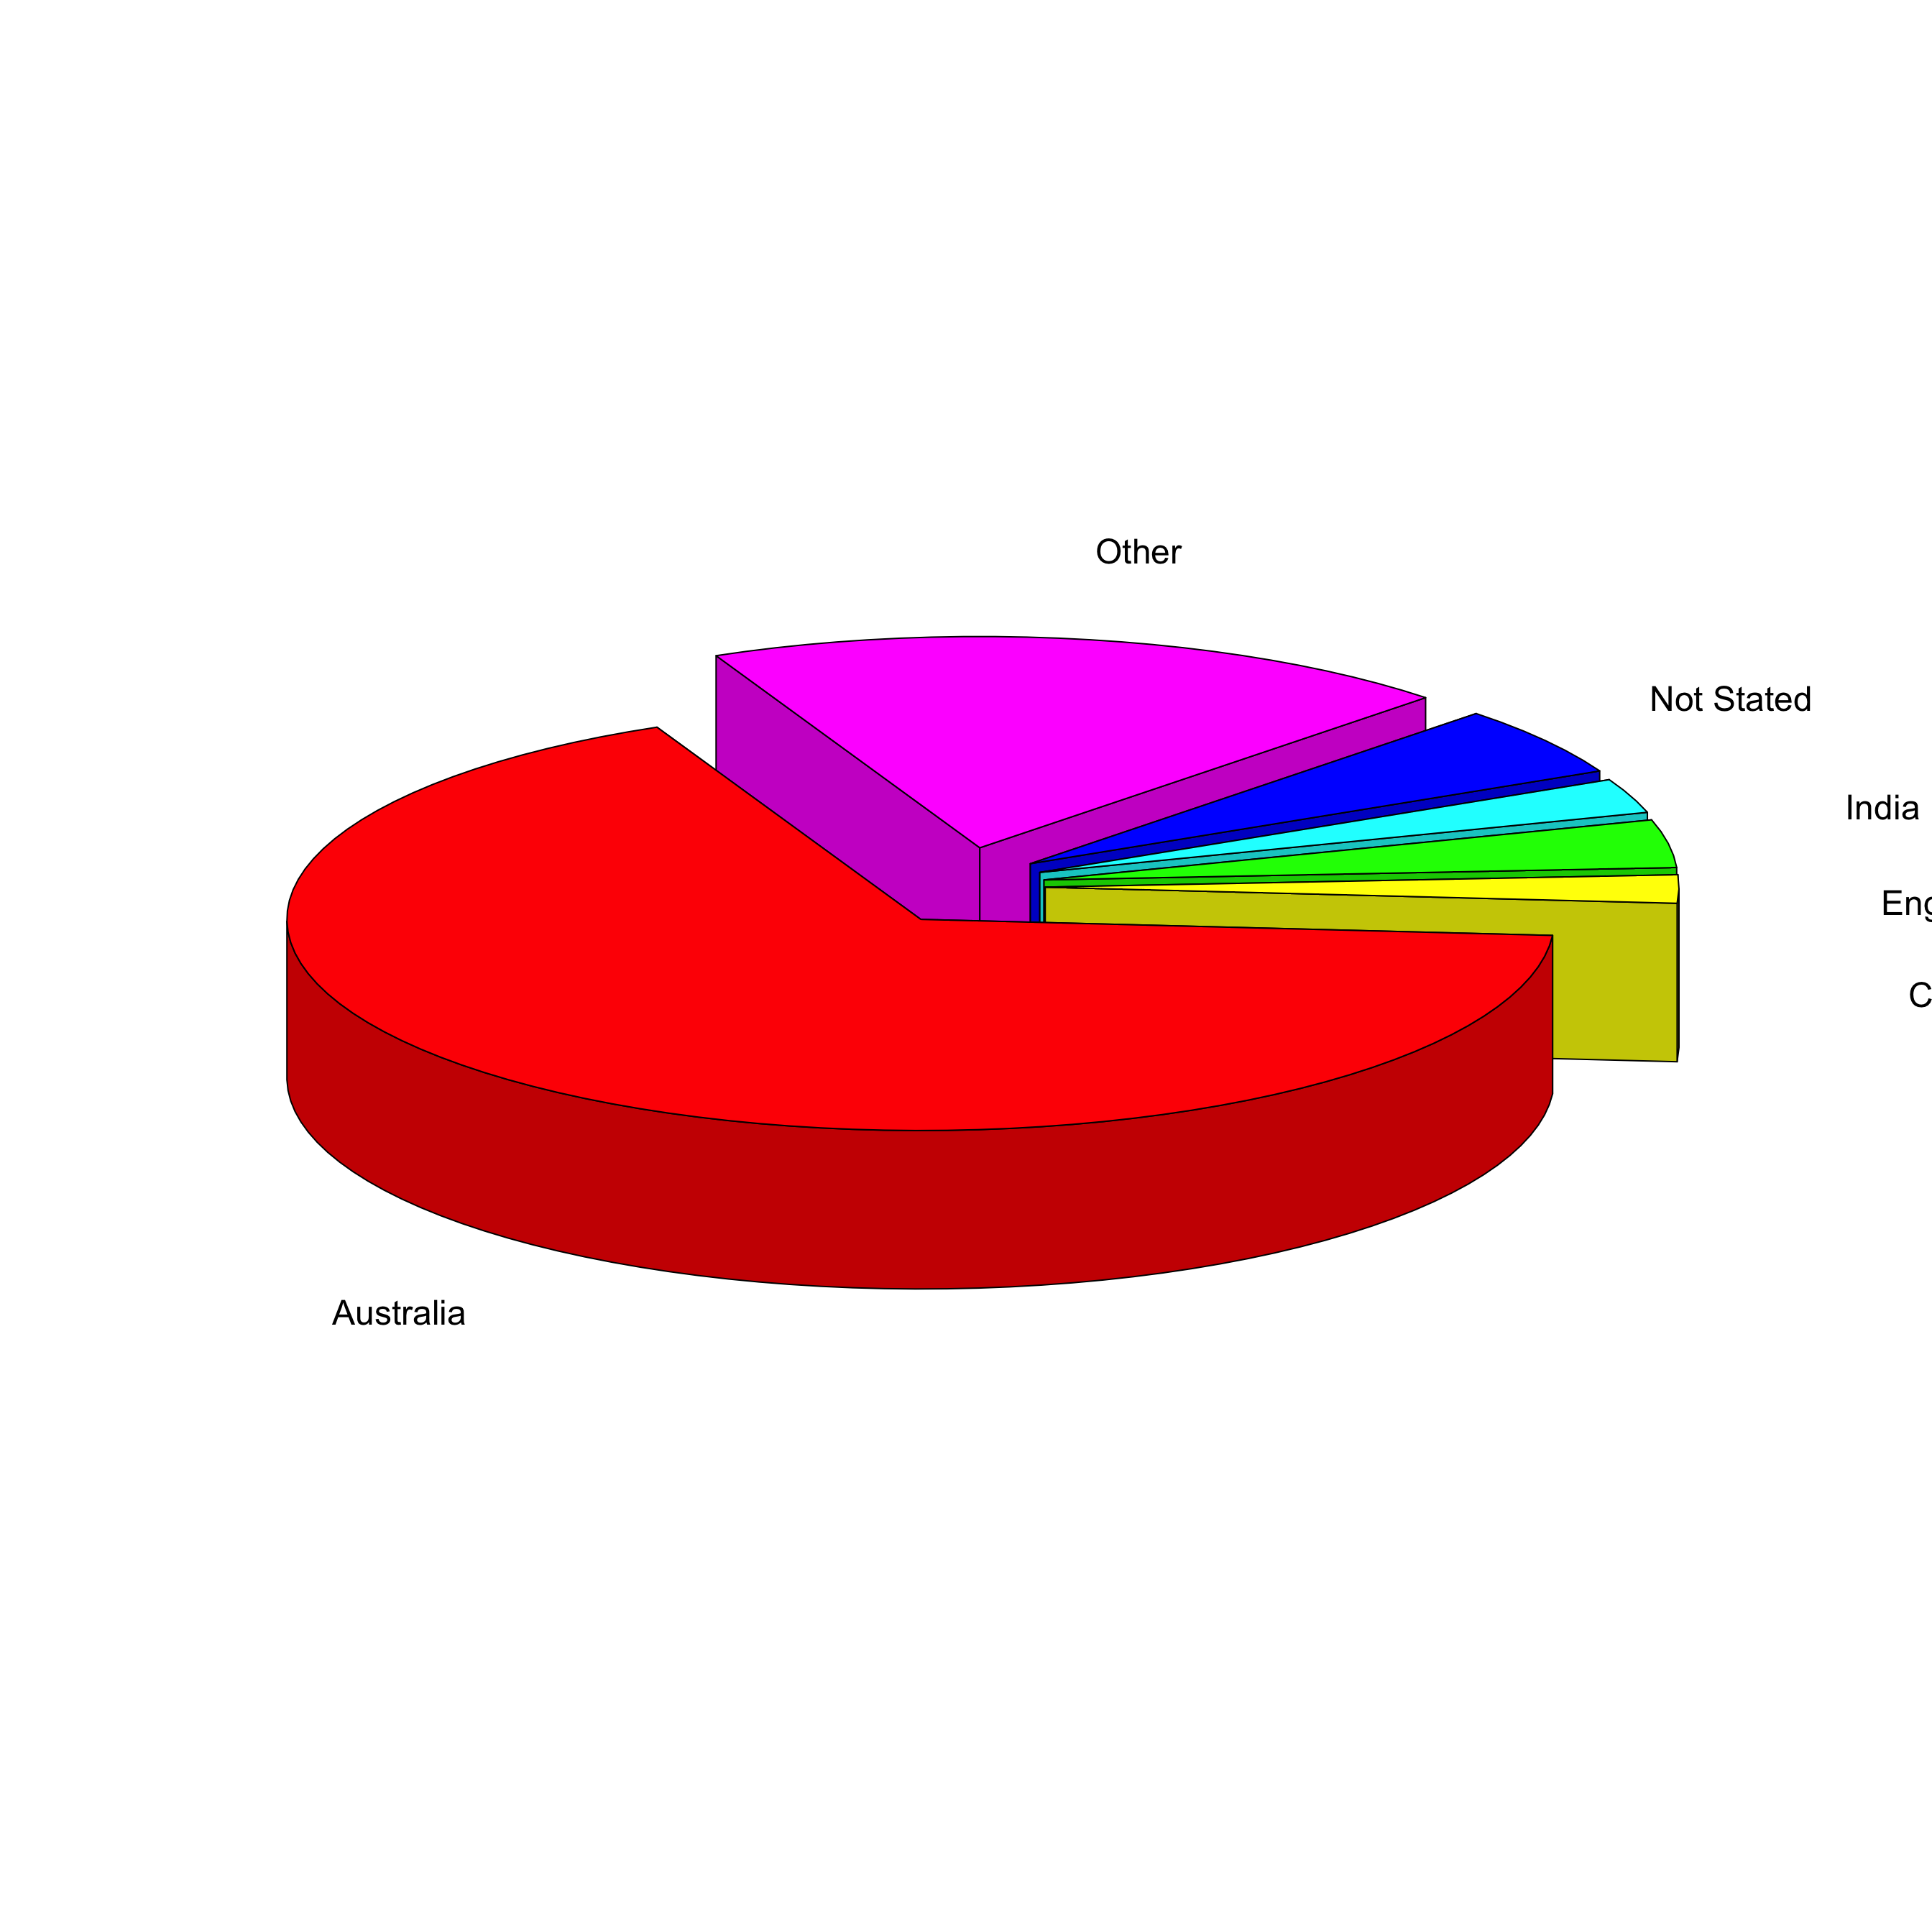
Why is a 3D pie chart considered a “bad plot”?
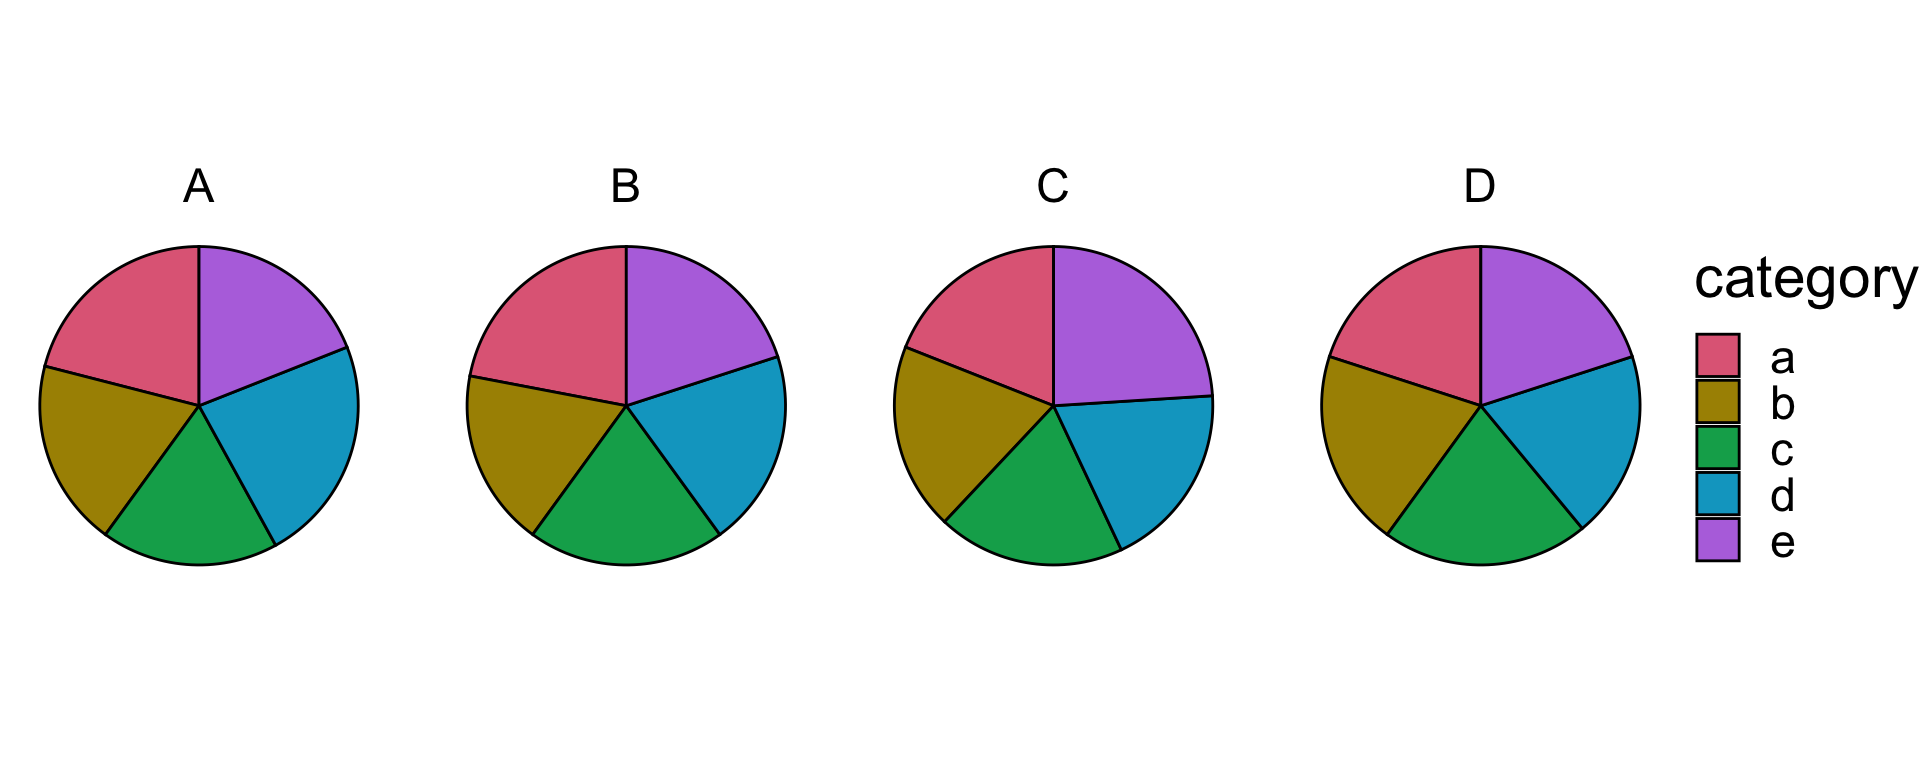
What about 2D pie charts?
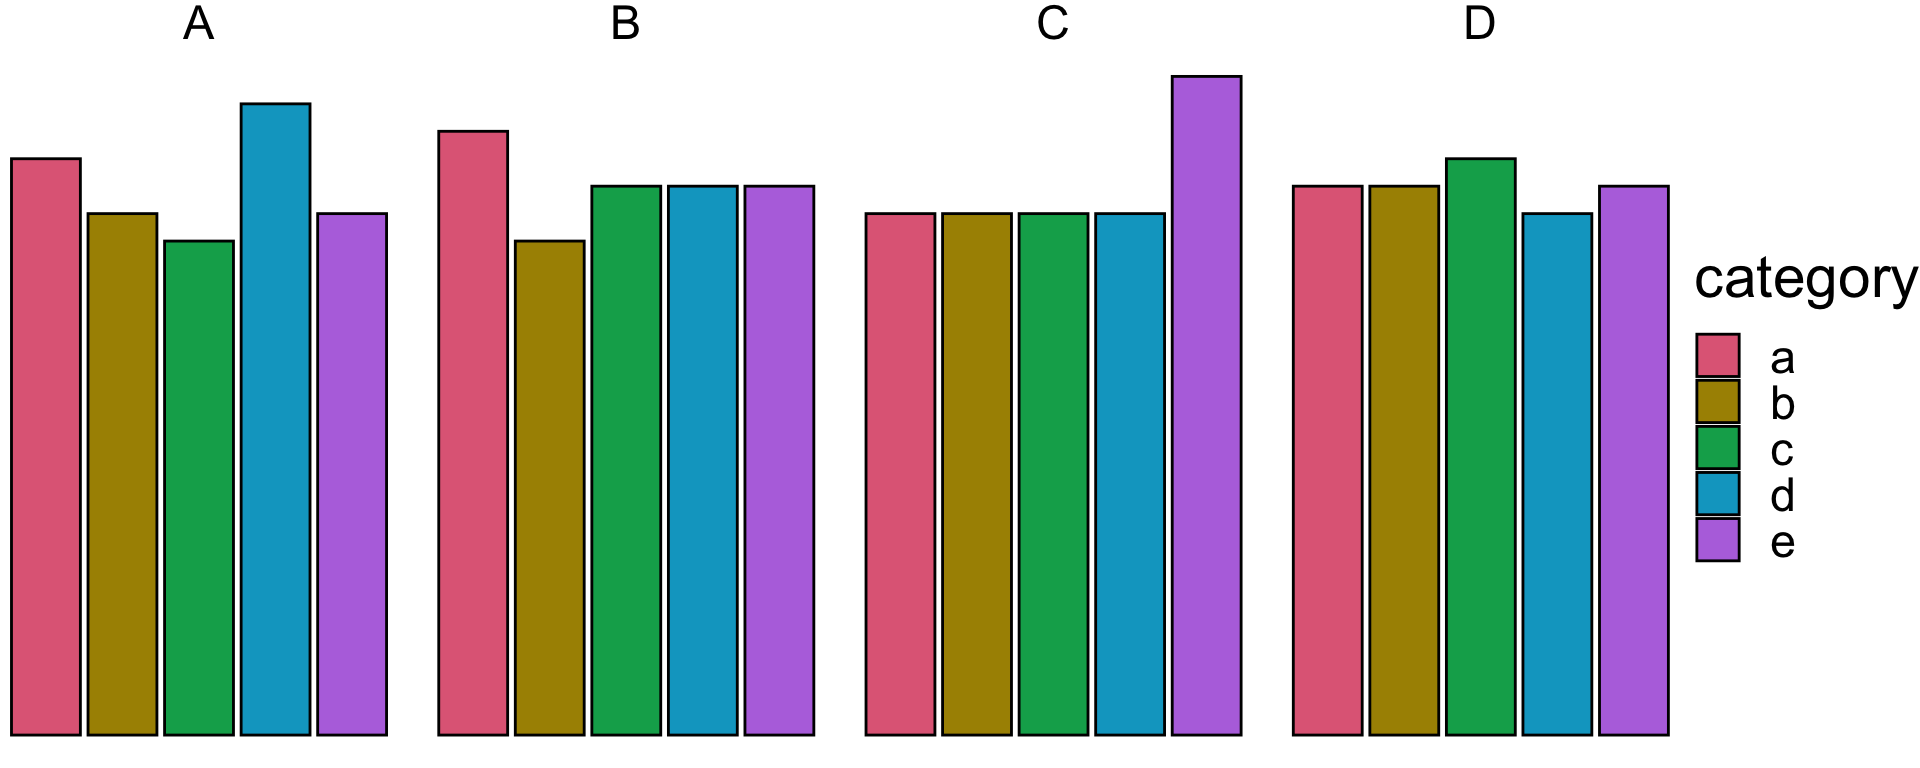
Pie charts are a very bad way of displaying information. The eye is good at judging linear measures and bad at judging relative areas. A bar chart or dot chart is a preferable way of displaying this type of data.
- This comes from empirical research of Cleveland & McGill (1984) among others.
Which category is the largest?
Elementary Perceptual Tasks
Non-exhaustive
Retrieving information from graphs
Of the 10 elementary perception tasks, Cleveland & McGill (1984) found the accuracy ranked as follows…
Rank 1
Example
Rank 2
Example
Rank 3
Example
Rank 4
Example
Rank 5
Example
Rank 6
Example
Preattentive processing
Preattentive processing
- Viewers can notice certain features are absent or present without focussing their attention on particular regions.
- Which plot helps you to distinguish the data points?
Communicating data
Data story
- Storytelling is a powerful technique to communicate data

Principles of Communicating Data
- Know your goal (target audience, intended message, desired effect)
- Use the right data
- Select suitable visualisations
- Design for aesthetics
- Choose an effective medium and channel
- Check the results, i.e. get feedback
Elements of statistical persuasion
- Magnitude of effects: the strength of a statistical argument is enhanced in accord with the quantitative magnitude of support for its qualitative claim.
- Articulation of results: the degree of comprehensible detail in which conclusions are phrased.
- Generality of effects: the replicability of the results.
- Interestingness of argument: the potential to change people believe.
- Credibility of argument: the believability of a claim.
Gestalt principles
- “Gestalt” is German for form or shape.
- A set of laws to address the natural compulsion to find order in disorder by perceiving a series of individual elements as a whole.
Law of Proximity
- By placing elements closer together, it makes it easier for you to group elements together as well as make comparisons.
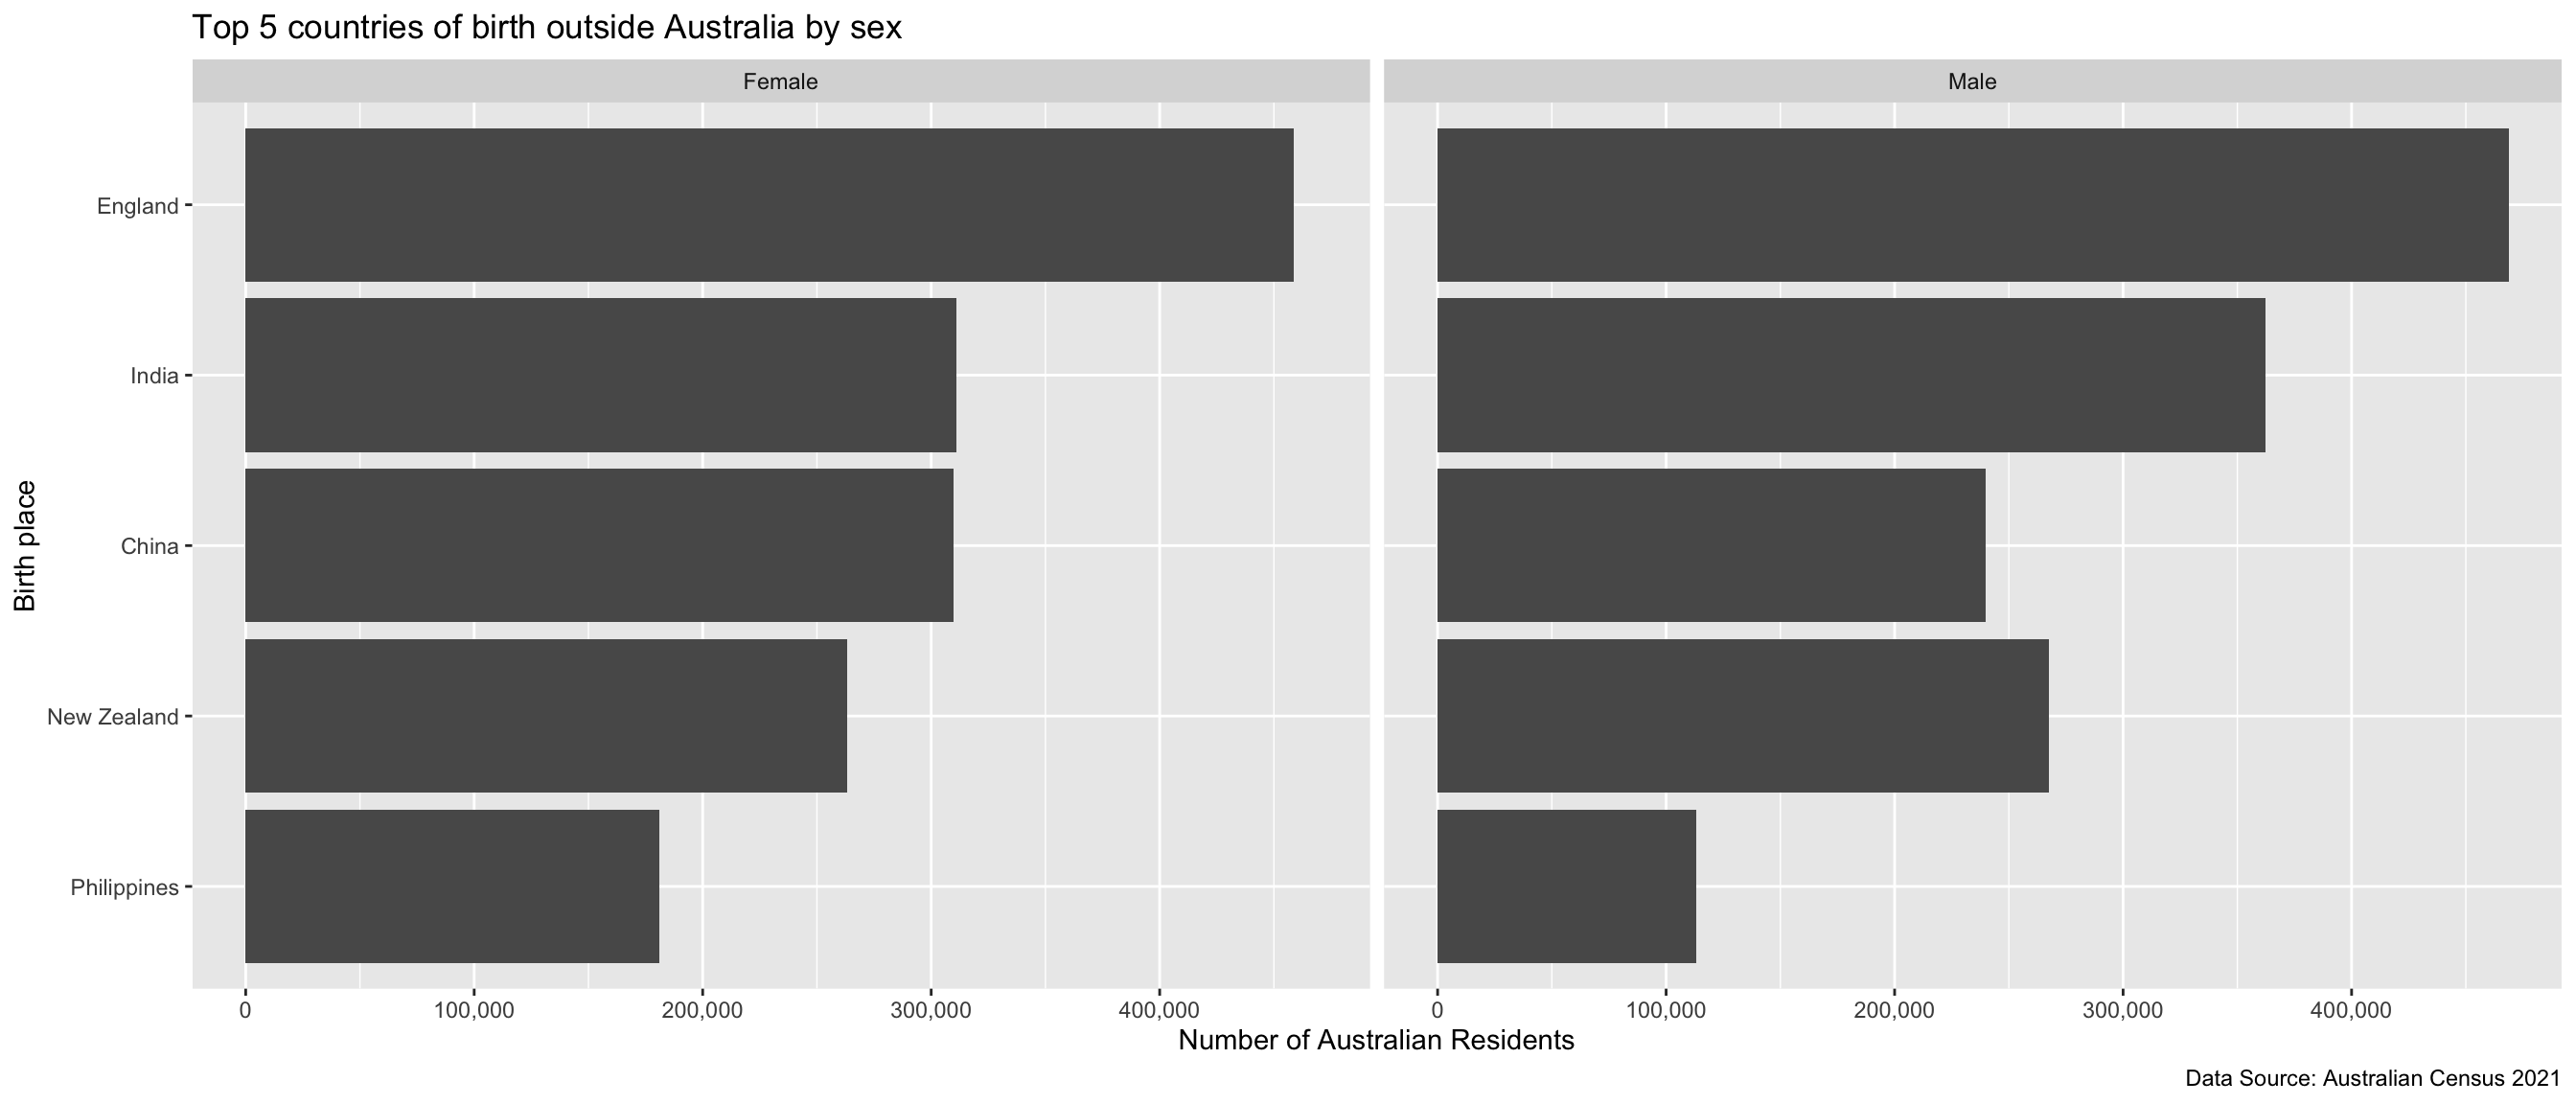
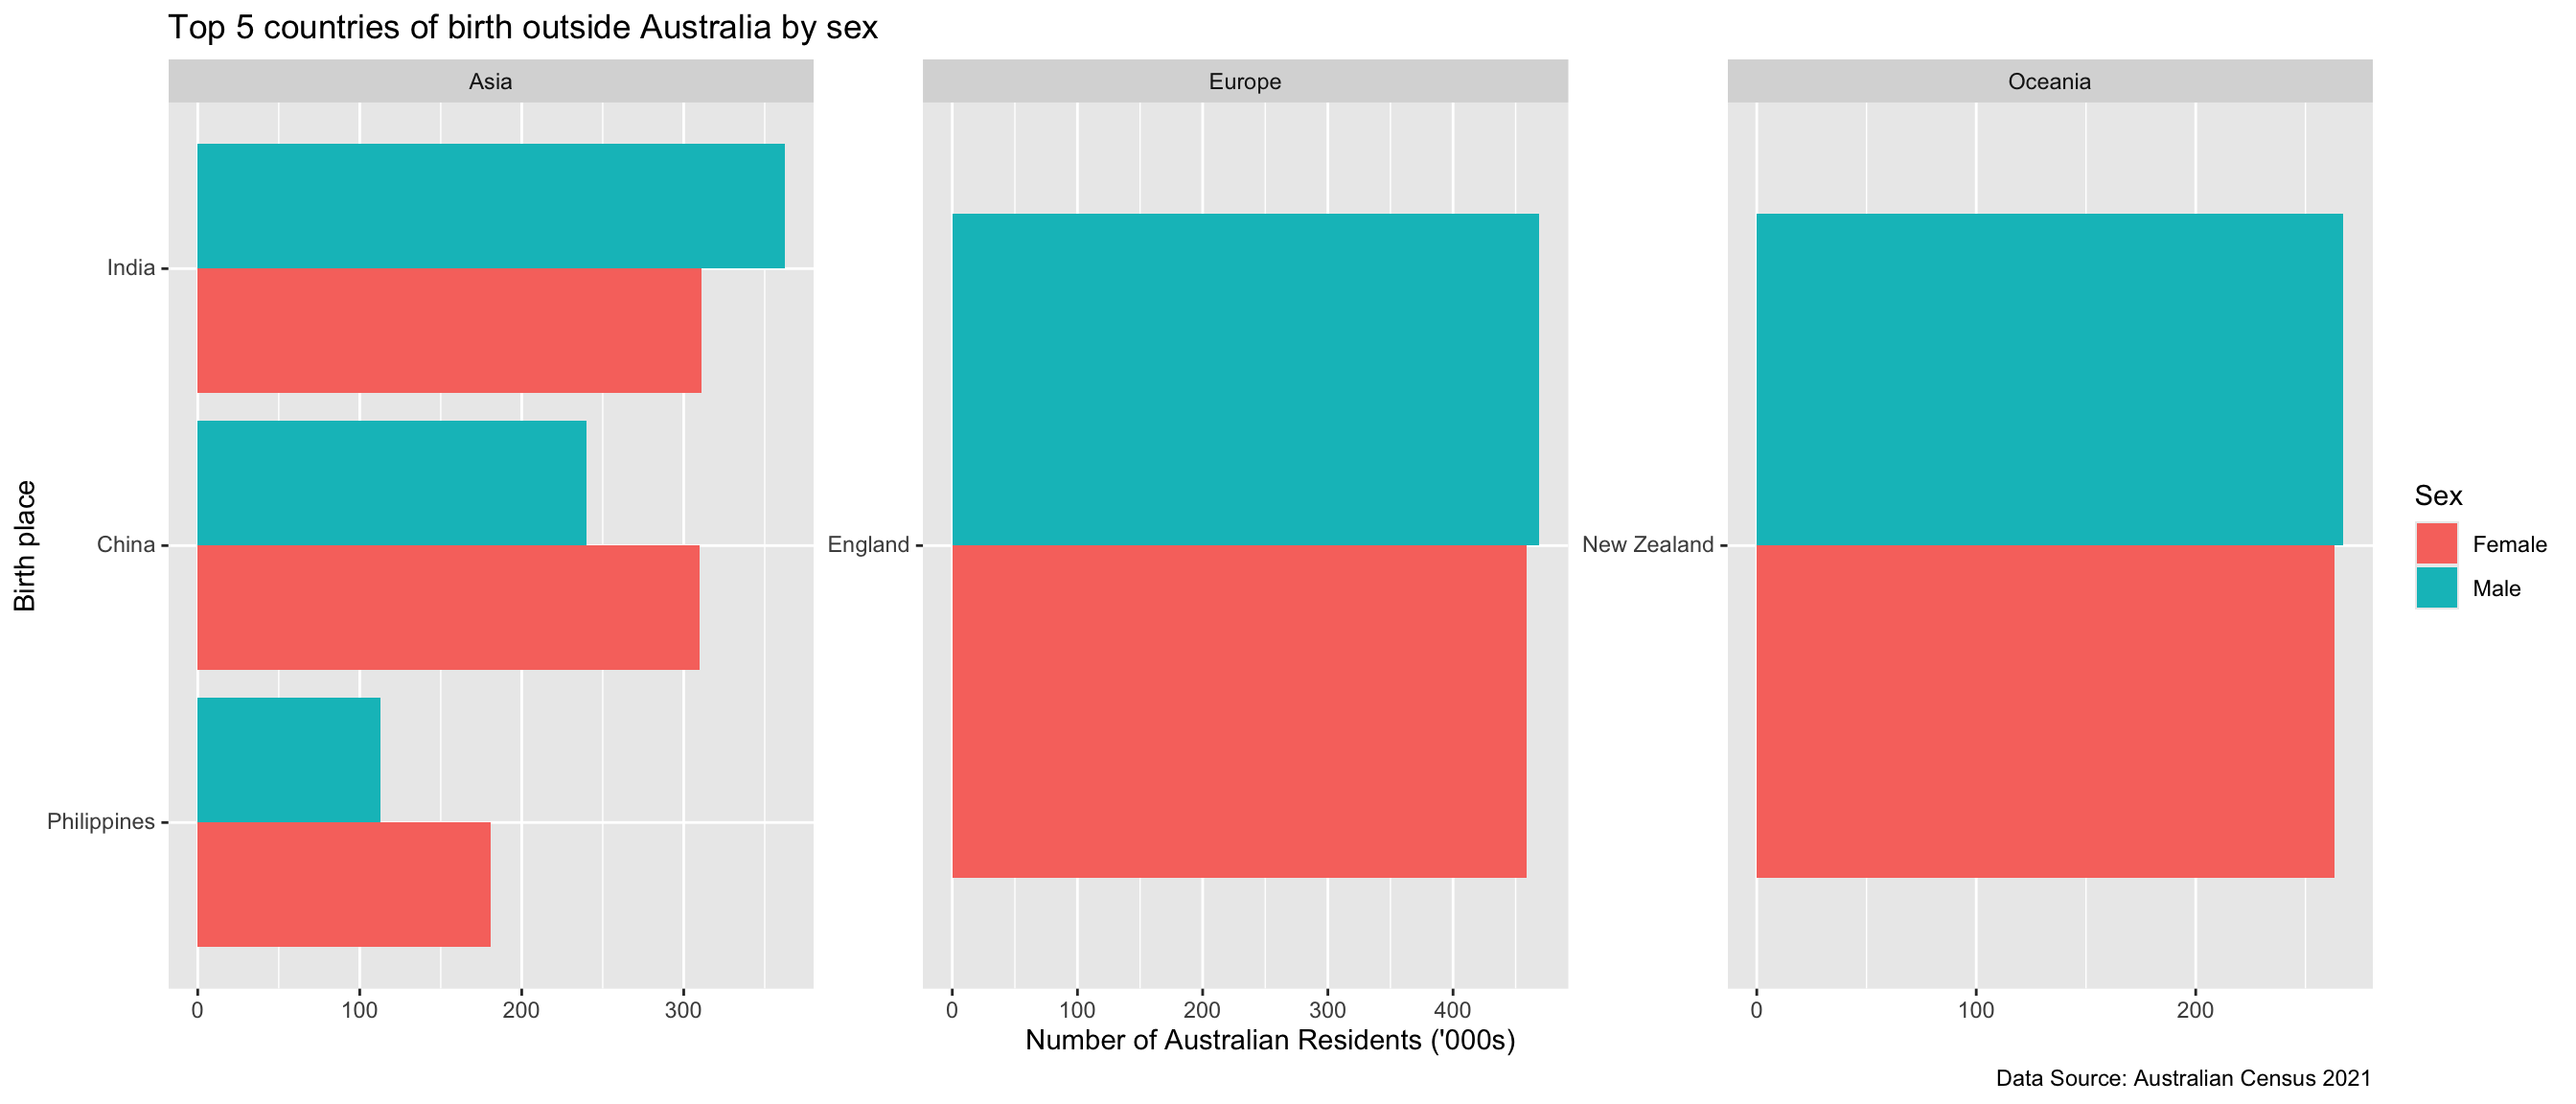
Can you tell which birth place have more women than men amongst the Australian residents?
Law of Proximity
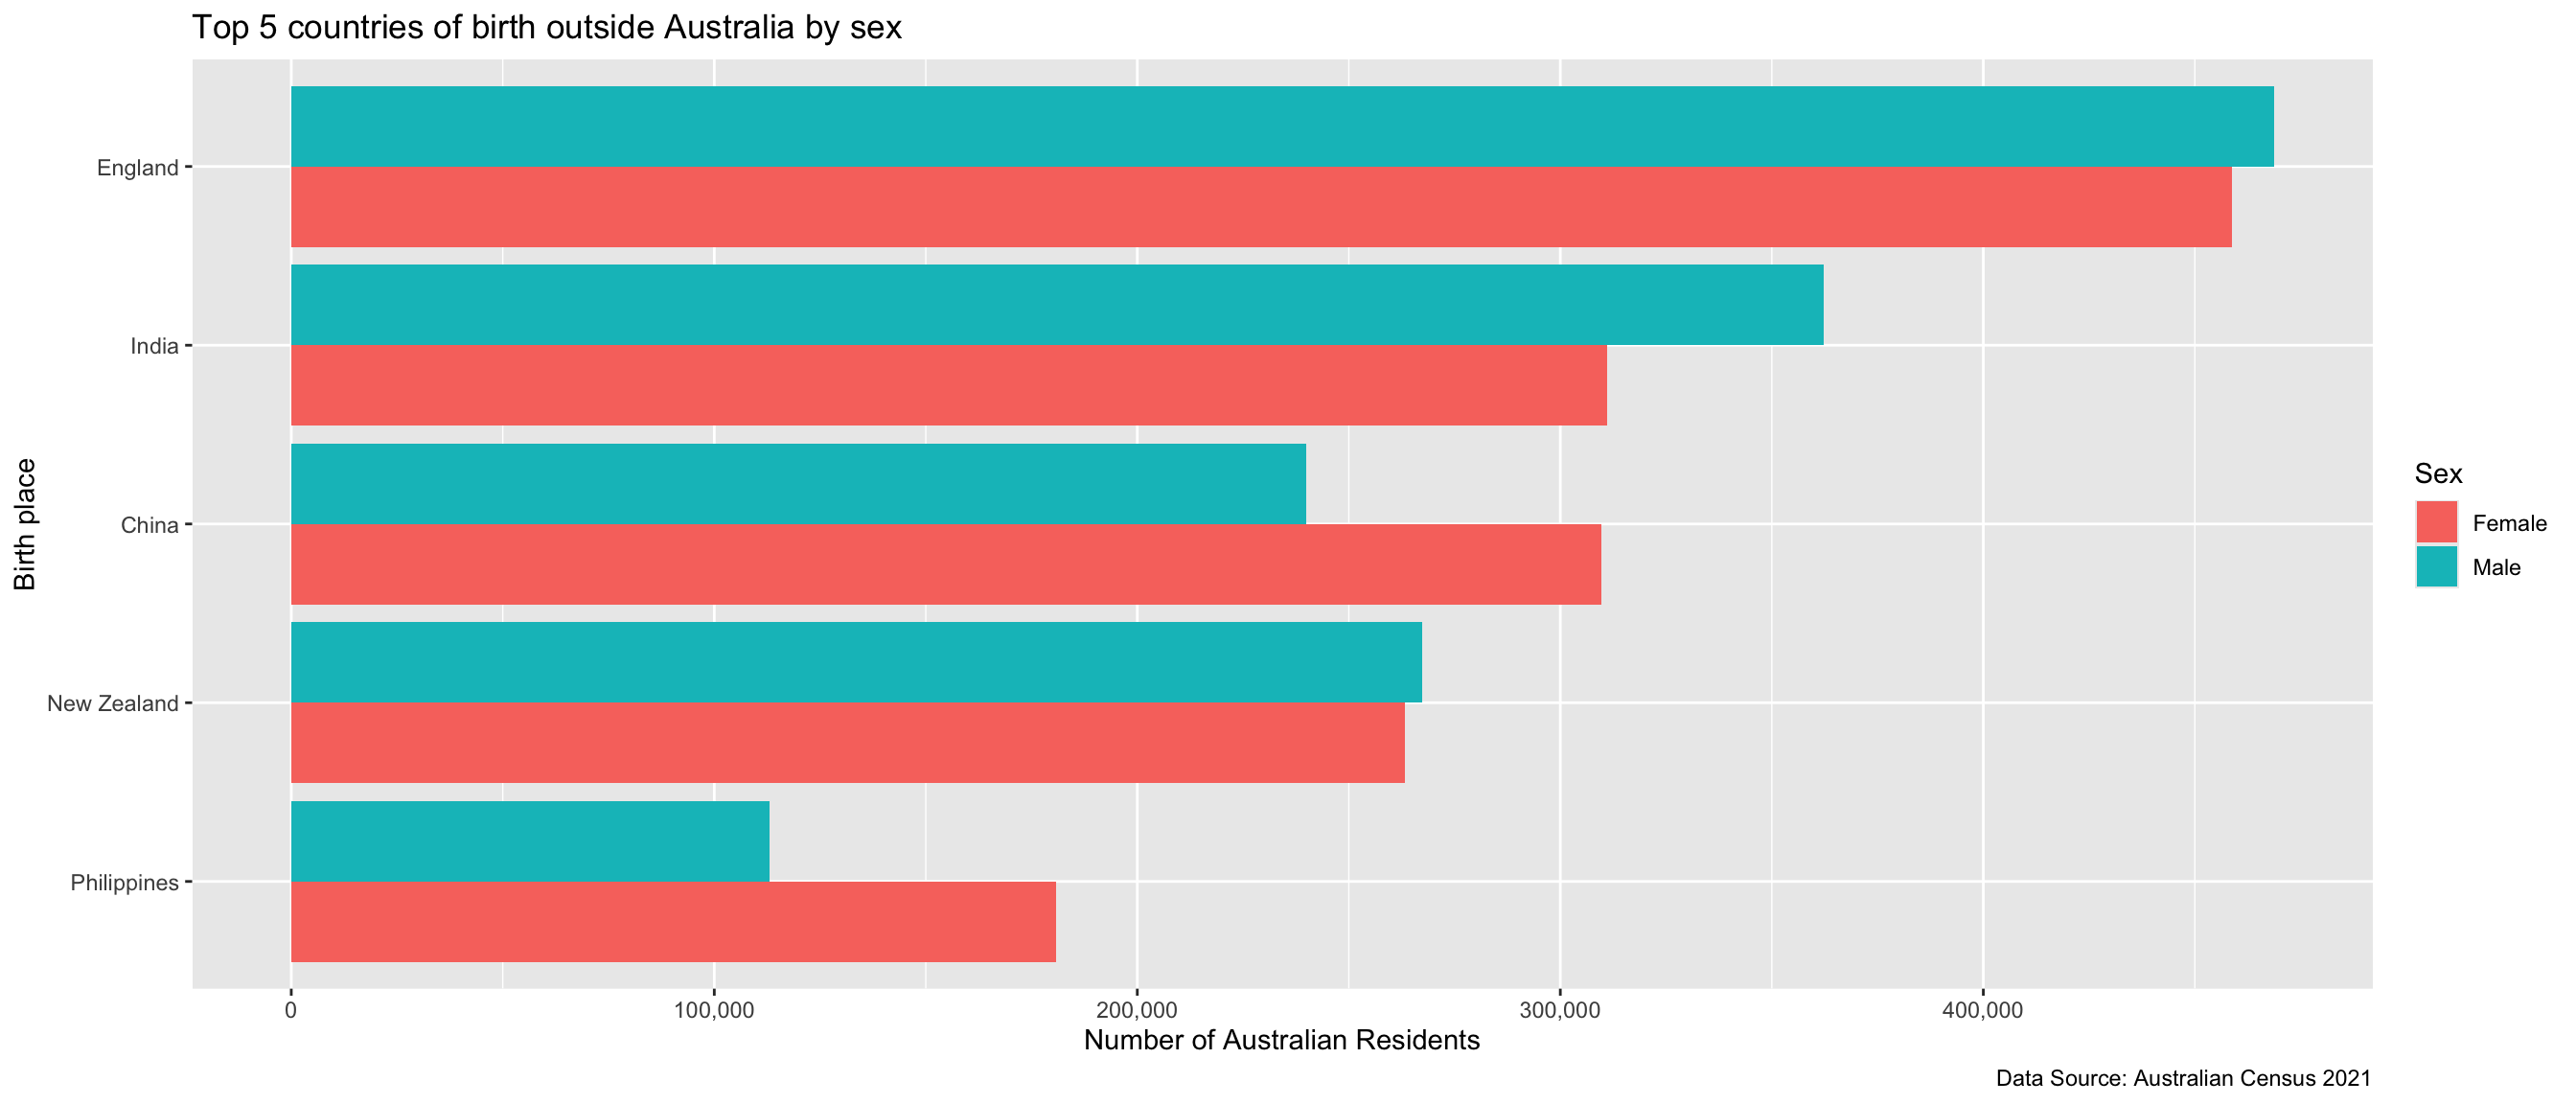
Data story
Census 2021 shows far more women born in Phillipines and China migrate to Australia than men born in their respective countries, whilst more men born in India migrate to Australia than women born in India.
Law of Similarity
- When objects share similar attributes, they are perceived as being part of the same group.
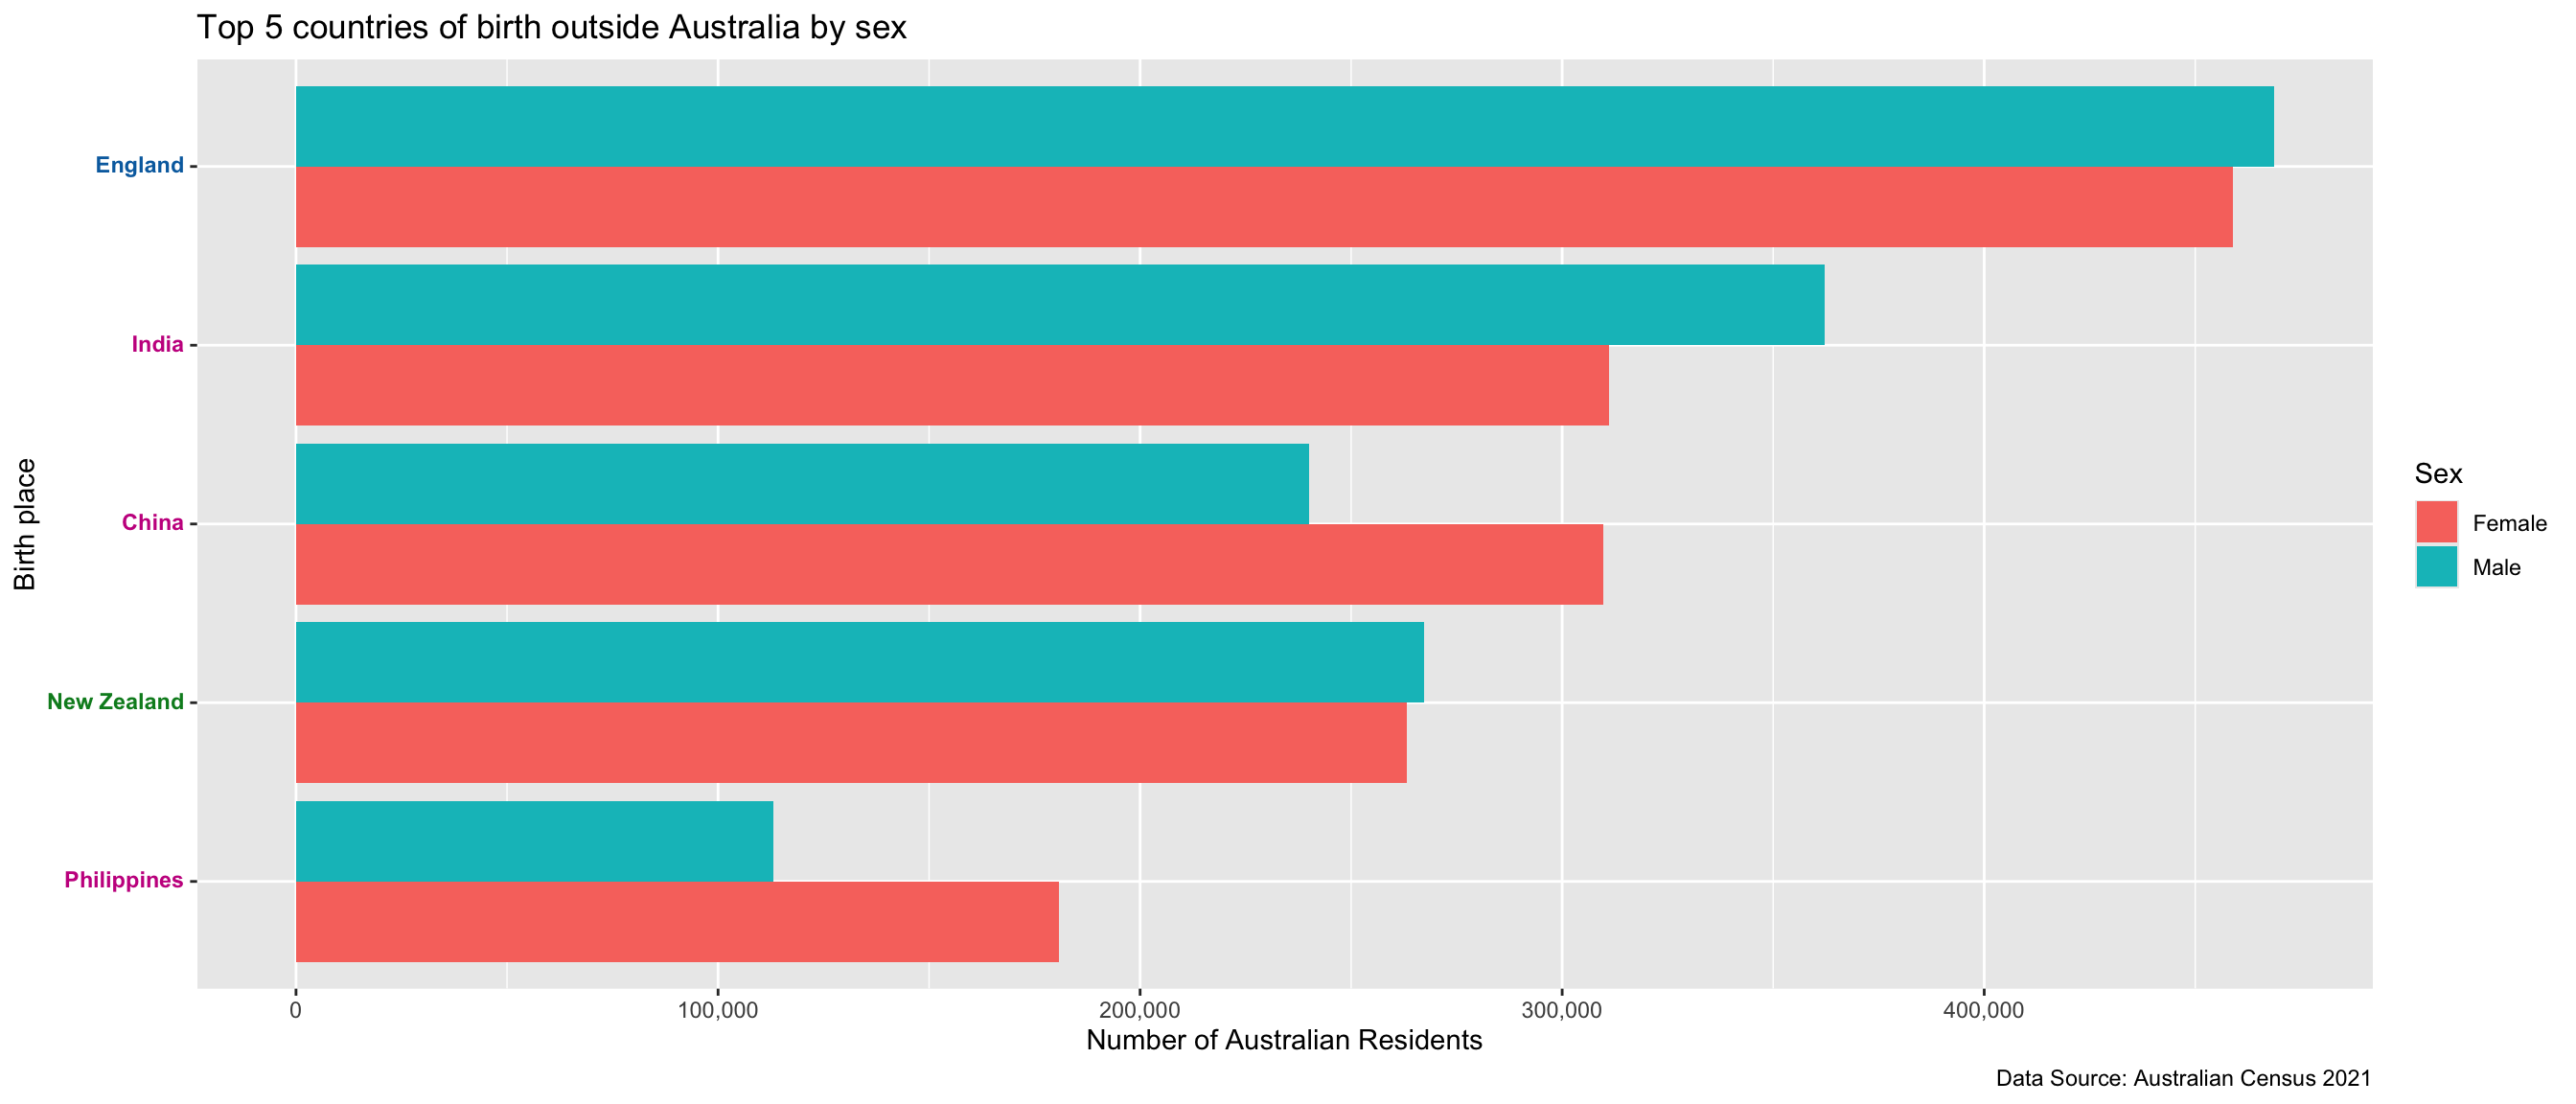
Notice that the countries are colored by their continent (Europe, Asia, and Oceania).
Law of Closure
- Objects collected within a boundary-like structure are perceived as a group.
